Well image log annotation tool
Some images and information in this case study were obfuscated or omitted due to NDA.
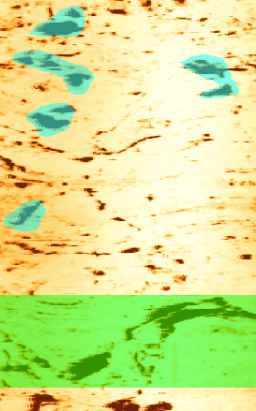
About
Well image logs are basically images taken from the walls surrounding that well that help geologists identify properties of the rocks around the well. Our client started implementing machine learning algorithms to identify these properties automatically. However, these algorithms need previously annotated data in order to learn more about the properties they need to identify. We had to build a tool to help geologists annotate image logs to be used as input for those algorithms.
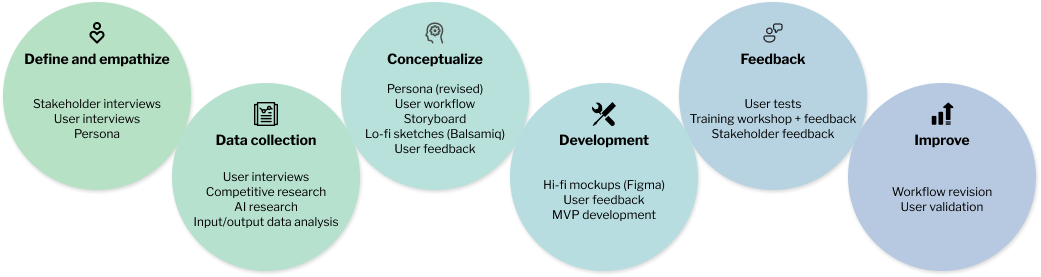
Process
Roles
- User research
- UX design
- Mockup design (Figma)
- User testing
- Tool/workflow Instructor
Goals
- Design a new well image log annotation tool
- Help users accurately identify and classify structures in an image log
- Create an onboarding process for users that aren't used to annotation tools
- Create a pleasant experience for a complex task
Research
I started this case by talking to some stakeholders about this new machine learning initiative. I wanted to understand more about what was the problem it was trying to solve, the workflow and how our annotation tool would fit into this.
Data annotation wasn't part of geologists' usual workflow.
Annotating well image logs is a complex process with a with a lot of ambiguity.
Well image logs can reveal hundreds of structures that have to be annotated. Annotating a well image log requires a lot of work and attention to detail. Some structures can be big, others small and once the user identifies a structure, they must say what kind of structure that is.
To leverage the machine learning algorithms' potential, it's important for multiple geologists to annotate the same data.
Design
We designed a very barebones prototype of an annotation tool. I invited two geologists to use this tool to identify structures in an image log.
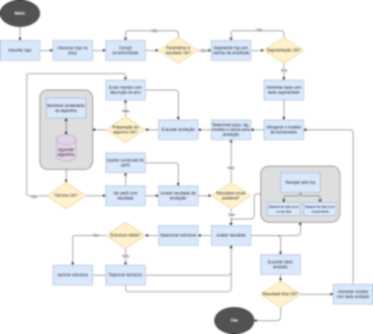
This experiment offered enough input to design a user journey map and a user flow diagram.
Then, I created a mockup on Figma to validate some ideas with geologists and developers.
Once we had the approval for the design, I developed the interface on Qt, which was used by the developers to implement all the behaviors of the tool.
Once the MVP was completed, I instructed a training workshop of our tool to a group of geologists.
Outcomes
The experiment with the prototype was very helpful. It highlighted several pain points during the annotation process.
The training workshop was a wonderful experience to get insights from more users.
Some users complained that the tool was a little bureaucratic. We simplified the steps that had shown to be more problematic in the next tool iteration.
Despite that, use logs of our tool show that geologists are starting to incorporate the annotation workflow. Not only they are using our tools, but they are going through the entire process up until the end, generating annotated data.
The logs also revealed that most of these users are going through the entire process up until the end, generating annotated data. Many of them did the process multiple times for different data.